
Capri Holdings Inc: A Case Study in Why Earnings Don’t Always Reflect Reality
When investors first glance at Capri Holdings Inc., the picture looks grim. The company is reporting a trailing twelve-month (TTM) loss of -$9.56 per share. To the casual observer, that might scream “bankruptcy risk.” But dig deeper, and you’ll see this is a classic case where accounting earnings don’t align with the company’s true financial health.
Why Earnings Can Be Misleading
Accounting earnings, the numbers most people see on the income statement, are heavily influenced by non-cash expenses (like depreciation or amortization), one-time charges, or even timing differences in revenue recognition. While these figures are useful, they often fail to capture the real economic engine of a company: its ability to generate cash.
As the old adage goes, “Cash is King.” Salaries, suppliers, infrastructure, research & development, share buybacks, and dividends—all of it is paid in cash, not “earnings.” That’s why seasoned investors and analysts tend to focus more on cash flow statements than on reported net income.
Capri’s Cash Flow Reality
So how can a company like Capri show such terrible earnings yet still be a going concern? The answer lies in its operating cash flow.
Looking at Capri’s latest cash flow statement, the company generated roughly $190 million in cash from operating activities over the past twelve months. That’s about $1.60 per share in positive cash flow—a far cry from the negative -$9.56 earnings figure reported on the income statement.
What does this mean? Simply put: Capri is covering its expenses through operations, with surplus cash left over to reinvest in growth, pay down debt, buy back shares, or even issue dividends. That’s the mark of a business that is self-sustaining and positioned to grow, even if the “headline” earnings number suggests otherwise.
Why the Disconnect Matters
The stark difference between Capri’s accounting earnings and cash flow earnings highlights why investors who rely only on the income statement may be misled. Retail investors often see the negative EPS figure, assume disaster, and panic-sell their shares. This drives the price down.
Meanwhile, informed investors and professionals recognize that the company is still cash-flow positive and fundamentally stable. They can scoop up shares at depressed prices, patiently waiting until the accounting earnings return to positive. At that point, retail investors typically rush back in, sending the stock price higher—long after the professionals have already secured their position.
This cycle underscores why financial literacy and professional guidance matter. Knowing where to look—and how to interpret the data—can give investors a significant edge.
The Oakridge Advantage
At Oakridge Financial Planning, our job is to cut through the noise. We look beyond surface-level numbers and focus on what truly drives shareholder value. Companies like Capri offer opportunities for disciplined, informed investors who know how to distinguish between short-term accounting noise and long-term fundamentals.
Whether you’re planning for retirement or pursuing another financial goal, having a professional advisor by your side ensures you don’t miss these opportunities—or fall into the traps that mislead many retail investors.
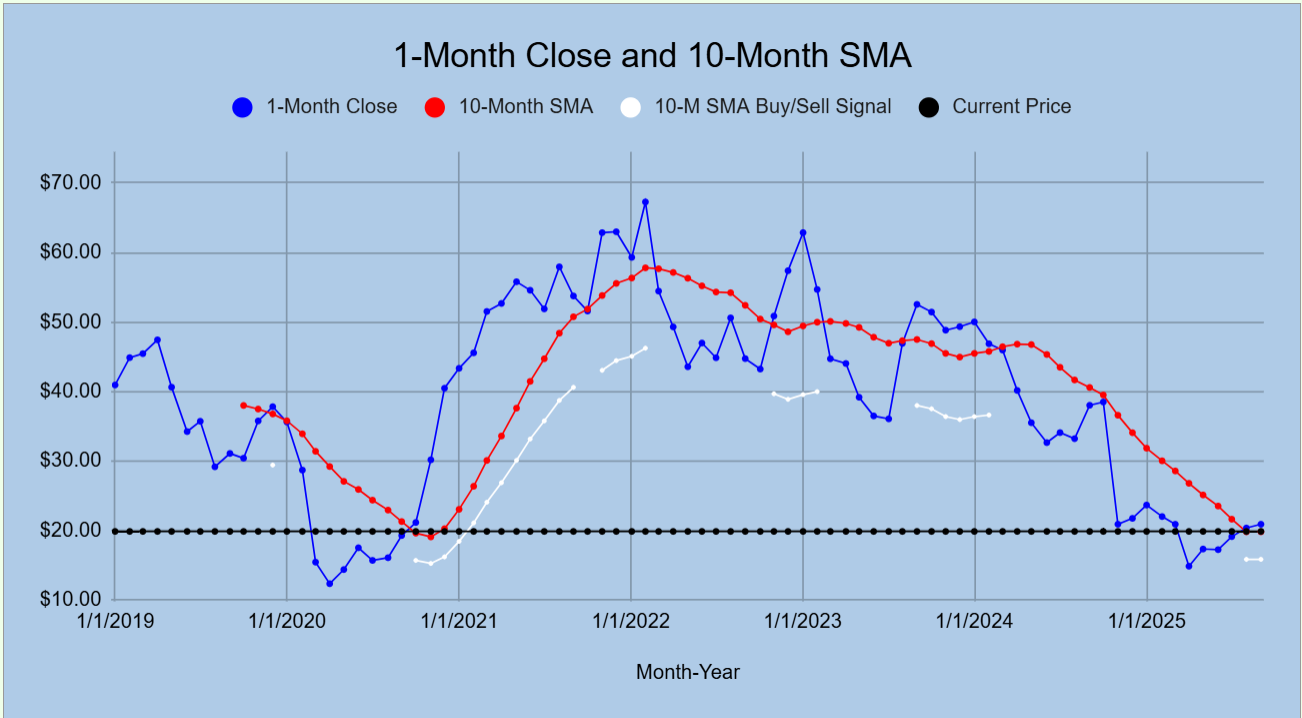
Trend Analysis: The Price Perspective
Looking beyond earnings and cash flow, it’s also important to consider how the market itself is interpreting Capri’s story. One of the most reliable ways to do this is by analyzing price trends through moving averages.
Long-Term Trend (1-Month SMA vs. 10-Month SMA): Capri’s longer-term moving averages are beginning to show signs of strength. The 1-month simple moving average (SMA) has recently crossed above the 10-month SMA, a signal that often points to the potential start of a sustained upward rally. This shift suggests that market sentiment is warming to Capri’s underlying fundamentals, even as reported earnings remain negative.
Short-Term Trend (50-Day SMA vs. 100-Day SMA): On a shorter horizon, Capri has already demonstrated strength. The 50-day SMA has moved above the 100-day SMA, confirming a recent rally in the stock. Shorter-term traders often see this as a momentum signal, while long-term investors may view it as early confirmation that the broader turnaround is taking hold.
Taken together, these trends imply that while retail investors may still be focused on Capri’s negative earnings, the market is quietly pricing in improvement—a classic setup where informed investors can get ahead of the curve.

Disclaimer
This article is for educational purposes only and should not be construed as financial, investment, or tax advice. Past performance is not indicative of future results. All investments carry risk, including the potential loss of principal. Please consult with one of our qualified financial professional before making investment decisions.
The Ridgeline Advantage
The free feed is just the start. To get the Surgical Entry Points and "Mythical" ratings used by pro traders, you need the full stream.
- 1,750+ Tickers Scanned: Proprietary technical & fundamental models.
- Direct Deliverables: Sortable Excel & Google Docs in your inbox daily.
- OFP Top 3 Picks: Our highest-conviction setups for the next session.
Exclusive Offer: Use code RDLINE3OFF for up to 60% OFF your first 6 months.
Start 7-Day Free Trial ($0.00 Due Today)